WCMSA Fiscal Year Statistics With Analysis and Observations

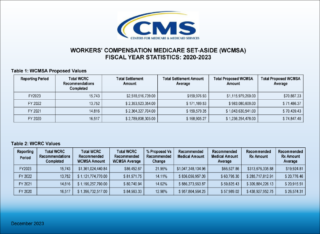
On December 4th, 2023, Centers for Medicare & Medicaid Services (CMS) shared a new report titled Workers’ Compensation Medicare Set-Aside (WCMSA) Fiscal Year Statistics 2023. The report provides four fiscal years of data regarding Workers’ Compensation Medicare Set-Aside (WCMSA) Proposed Value and Workers’ Compensation Review Contractor Values (WCRC) from 2020 to 2023.
Takeaways
Total Submissions
Total WCMSA submissions to CMS declined steadily between CMS’ FY 2020 and FY 2022, descending from 16,517 to 13,752, a reduction of almost 17% in three years. FY 2023’s 15,743 submission count represents a reversal of that trend for the time being. This may be the result of the appearance of Section 4.3 in the WCMSA Reference Guide in 2022, in which CMS speaks about “non-submit” or “evidence-based” MSA programs, describing them as “a potential attempt to shift financial burden”.
Proposed vs Recommended
Those who decided to voluntarily submit their proposed WCMSA to CMS for review were rewarded with recommendations that were, all told, 22.95% percent higher than the proposed amount. For comparison, the average percentage difference between the submitter’s proposed MSA and CMS’ recommended MSA for CMS’ FY 2020 through FY 2022 was 13.9%. This is an increase of roughly 65% in CMS’ FY 2023 versus the prior three years’ average. Not only is the counter percentage higher, but the total recommended amount is higher. So, it’s not as if submitters have been lowballing their submissions. For those who embraced a non-submit program for fear of significantly higher MSA counters, CMS dangled no carrots in FY 2023 to encourage a return to voluntary submission.
Proposed MSAs and Total Settlement Amounts
WCMSAs submitted by the industry have, on average, consistently ranged between a proposed amount of $70,439 and $74,847 between CMS’ FY 2020 and FY 2023. Total Settlements utilizing WCMSAs over the same period have averaged between $159,579 and $171,170. Accordingly, WCMSAs constitute around 43% of the total settlement amount in which they are included (pre-CMS recommendation).
Medical vs Rx
Medical expenses with MSAs have increased steadily in recent years and CMS’ FY 2023 is no exception. CMS’ recommended total for the medical portion of submitted WCMSAs is up 13% since 2020. Conversely, Rx expenses have declined by 33%. While several factors are likely to be at play here, CMS’ use of sometimes aggressive NDCs to price drugs may be one culprit. Medivest consistently sees submitted MSAs priced using drug NDCs unavailable in the actual market, and well below market average.
The Big Question
These are statistics from those WCMSA’s submitted for approval, meaning they were written by industry-trained professionals in an attempt to match CMS’ recommended methodology. If the industry is consistent, what has changed at CMS? Also, what does this say about CMS’s position concerning non-submitted WCMSA’s that were written to Evidence-Based Medicine or other non-submit standards in light of the previously modified Section 4.3 of the WCMSA Reference Guide?
For Additional Information
Medivest will continue to monitor changes occurring at CMS and will keep its readers up to date when such changes are announced. For questions, feel free to reach out to the Medivest representative in your area by clicking here or call us directly at 877.725.2467.